Office 365 Now Has 85 Million Commercial Subscribers and 24 Million Consumer Users

microsoft-office-revenue-presentation-696x391

Office 365 has grown considerably since this tie last year, with commercial revenue growth up by 51% and active users by 40.

The total of Office 365 consumer subscribers is now 24 million, while the commercial market has 85 million. In total, commercial revenue growth is up by 51%, and active users are up by 40%.

Office 365 Now Has 85 Million Commercial Subscribers and 24 Million Consumer Users

What is a (SharePoint) team site?

A SharePoint team site connects you and your team to the content, information, and apps you rely on every day. For example, you can use a team site to store and collaborate on files or to create and manage lists of information. On a team site home page, you can view links to important team files, apps, and web pages and see recent site activity in the activity feed.

https://support.office.com/en-us/article/What-is-a-team-site-75545757-36c3-46a7-beed-0aaa74f0401e

INTRODUCING SMART DIAGRAMS FROM VISIO FOR WINDOWS

https://microsoft.qualtrics.com/jfe/form/SV_9MNcyWmZghnDP8x?wt.mc_id=soc_tw_o365cons_Visio-Data-to-Process_static

We are pleased to announce an **early preview** of data-driven smart diagrams for the first time in Visio, brought to you exclusively by the Office Insider Program.

Do you currently spend hours connecting shapes, placing the shapes into the right Swim lanes  to create the perfect layout? Looking to save time while creating your process diagrams from data every day?

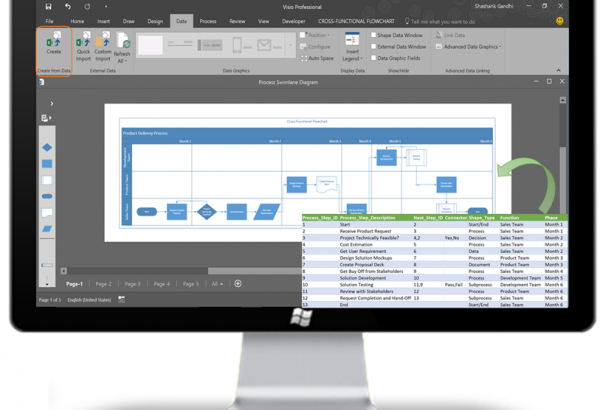
With Visio’s data-driven smart diagrams feature, now you can automatically create a Basic Flowchart or Cross-Functional Flowchart from your process map in Excel, in no time.

The process meta data or metric data that you capture in Excel columns gets stored in Visio shapes as shape data.


Microsoft MyAnalytics Outlook add-in

The MyAnalytics Outlook add-in helps you understand the reach of your emails and your relationships with colleagues.

For emails you send, the add-in shows the number of people who have read, forwarded, and replied, as well as a lifespan chart showing the email’s read activity. You’ll only see these statistics for emails you’ve sent to at least five people, and you can’t identify who read or forwarded the email.

For emails you receive, the add-in gives you information about your relationships with colleagues, including the number of emails you’ve exchanged, your average response times, and the percentage of their email you read. Only you have access to your personal relationship statistics.

https://support.office.com/en-us/article/Microsoft-MyAnalytics-Outlook-add-in-e305ae2d-6f16-4688-b2b0-487c4c2d067b?ui=en-US&rs=en-US&ad=US